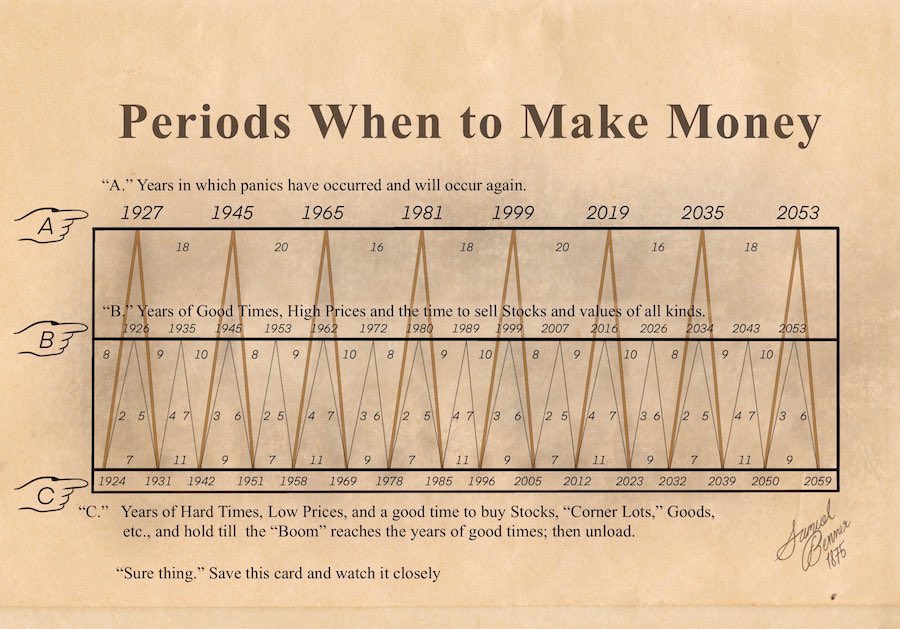

Samuel Benner's analysis from 1875 accurately predicted periods of panic, ideal times to buy and sell, and major events such as the Great Depression, World War II, the Dot Com Bubble, and the recent COVID crash.
Currently, the analysis suggests that we are in a phase of decreasing asset prices, which may indicate a good time to buy assets soon.
By @Nfthere
Image credit @Yahoo Finance
Currently, the analysis suggests that we are in a phase of decreasing asset prices, which may indicate a good time to buy assets soon.
By @Nfthere
Image credit @Yahoo Finance
Samuel Benner's analysis from 1875 accurately predicted periods of panic, ideal times to buy and sell, and major events such as the Great Depression, World War II, the Dot Com Bubble, and the recent COVID crash.
Currently, the analysis suggests that we are in a phase of decreasing asset prices, which may indicate a good time to buy assets soon.
By @Nfthere
Image credit @Yahoo Finance